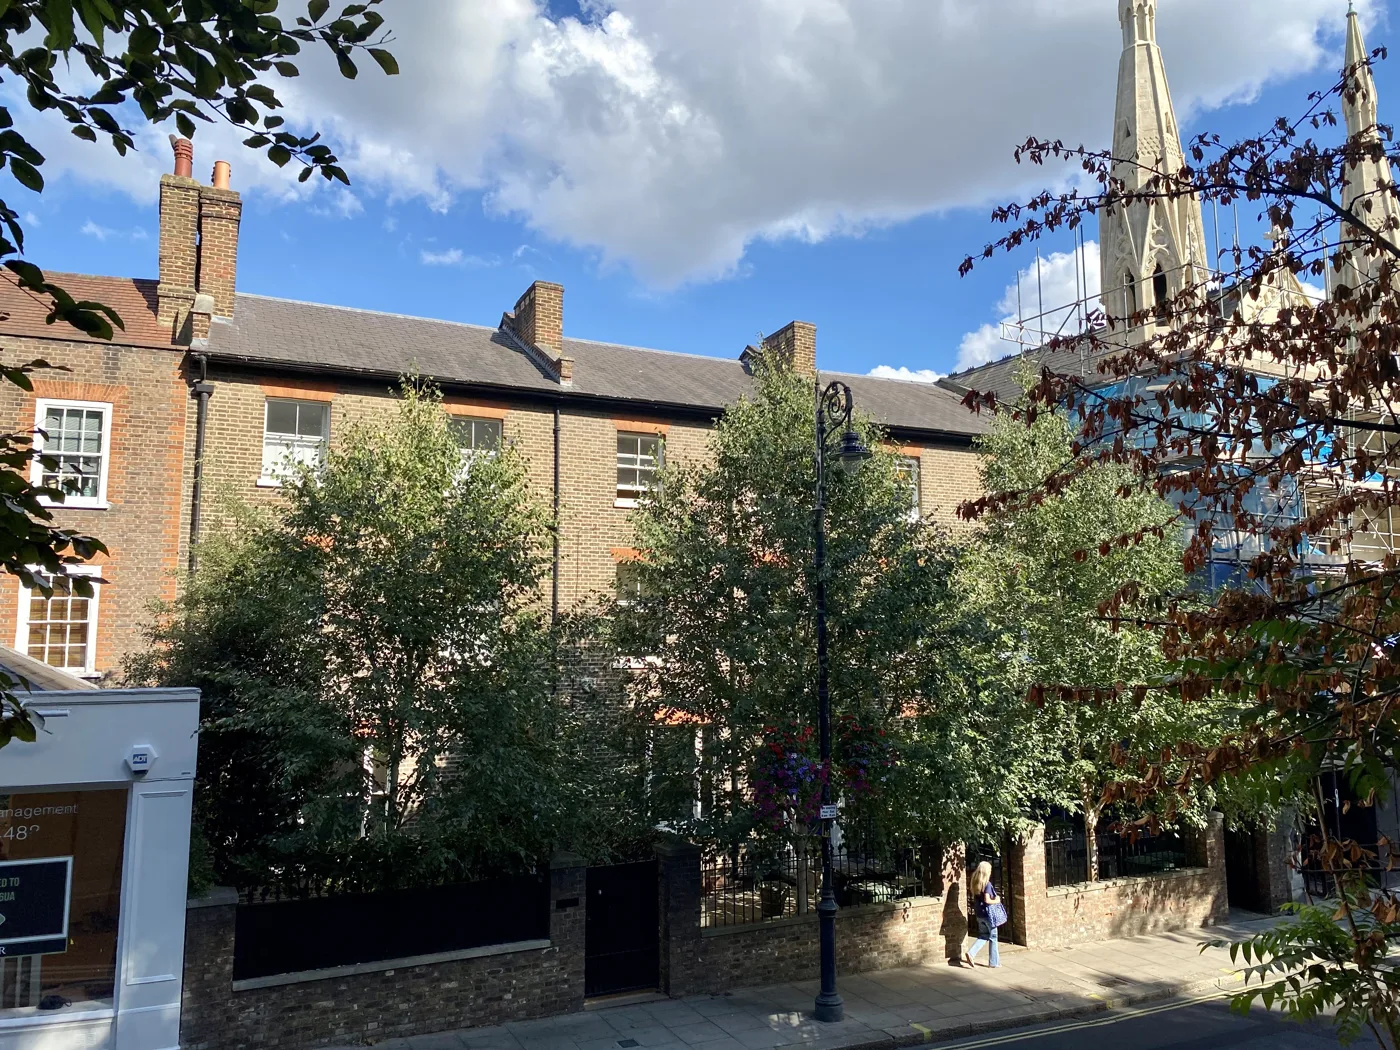

The typical Camden home sold for £740,000, from 1,301 Land Registry sales. Ward medians run from £1.6m in Hampstead Town down to £521,000 in Kilburn.
Two official records tell you what a home in Camden is worth, and they answer different questions. HM Land Registry’s Price Paid record lists every completed sale, which is what lets you compare Hampstead Town with Kilburn. The UK House Price Index gives a borough average adjusted for the mix of properties sold, which is the number to watch if you want to know which way the market is moving. This page uses both, and no asking prices appear anywhere in it.
What a Camden home actually sold for
The median Camden sale was £740,000. That comes from 1,301 completed sales in the borough registered between July 2025 and June 2026, pulled from HM Land Registry’s Price Paid data and filtered to standard, full-market residential transactions.
The median is the middle sale: half of Camden’s homes changed hands for less than £740,000 and half for more. It is the more useful number here than the average, because Camden’s average is dragged upward by a handful of enormous sales at the top. Over these twelve months the borough recorded a £53 million house on Avenue Road and a £25.9 million house on Merton Lane. The mean sale price across the same 1,301 transactions is around £1.16 million, which is not a figure that describes anybody’s house hunt.
Camden is a borough of flats, and that changes everything
Before any comparison with another borough makes sense, one fact has to come first. Of the 1,301 sales, 1,071 were flats or maisonettes: 82 per cent. Another way to see the same thing is tenure: 1,068 of the 1,301 sales were leasehold and only 233 freehold.
So Camden’s £740,000 median is mostly the price of a flat. Split by property type, the picture is much wider than that single number suggests:
| Property type | Sales | Median price |
|---|---|---|
| Flat or maisonette | 1,071 | £660,000 |
| Terraced house | 160 | £1,726,750 |
| Semi-detached house | 50 | £2,717,500 |
| Detached house | 20 | £4,590,000 |
A house in Camden is a different market from a flat in Camden, not a dearer version of it. The step from the typical flat to the typical terraced house is just over a million pounds. Detached houses barely exist here: twenty sold in a year across the whole borough.
Which way prices are moving
For direction of travel the Price Paid median is the wrong tool, because the mix of what sells changes month to month. The UK House Price Index adjusts for that, and its most recent figure for Camden is July 2026: an average of £815,159, down 10.1 per cent over the year.
| Area | Average price | Change over 12 months |
|---|---|---|
| Camden | £815,159 | −10.1% |
| London | £550,037 | −3.3% |
| England | £293,479 | +1.1% |
That annual fall is measured against July 2025, which at £907,073 is the highest monthly average the index has given Camden in the eleven and a half years we have checked, from January 2015 onward. The borough’s low point in the current cycle is February 2026, at £795,336. Prices rose into May, then fell in June and again in July. Treat the newest month as provisional: when the July figures landed, April was revised up from £793,161 to £805,447 and May from £830,654 to £843,425.
Camden is falling while England is rising, and it is falling faster than London as a whole. The borough sits at the expensive end of a market where the expensive end has been the weakest part: in the year to July 2026 Westminster fell 20.7 per cent, Tower Hamlets 14.4 per cent and Kensington and Chelsea 14.1 per cent, while Haringey rose 1.0 per cent. The sales figures point the same way: the twelve months to June 2026 produced steadily fewer registered sales each month, from 166 in July 2025 down to double figures by the spring. Some of that tail is registration lag rather than a real collapse in activity, because a sale takes several weeks to reach the register after it completes.
Camden house prices by ward
Every sale’s postcode was mapped to its ward through postcodes.io, which uses the ONS postcode lookup. All twenty Camden wards recorded sales, and the spread between them is a factor of three.
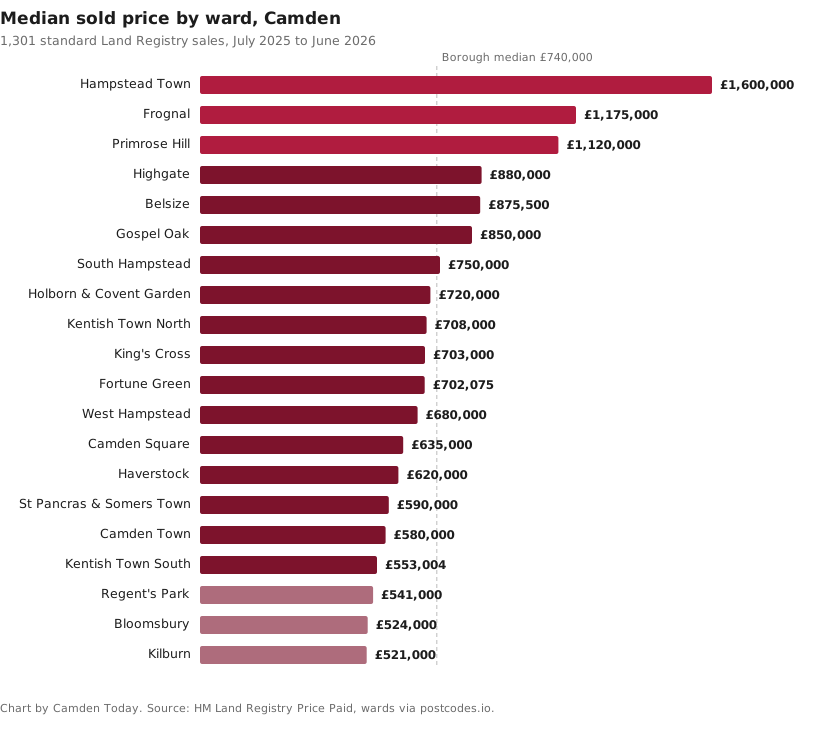
Hampstead Town (£1,600,000), Frognal (£1,175,000) and Primrose Hill (£1,120,000) are the top three, and they are the three wards where whole houses, rather than converted flats, make up the most of what sells. Hampstead Town’s house median alone is £3,597,500, and Frognal’s is £4,150,025.
At the other end, Kilburn (£521,000), Bloomsbury (£524,000) and Regent’s Park (£541,000) are the wards where a buyer has the most chance of getting into the borough. In each case the reason is the same: almost everything that sells there is a flat. Bloomsbury and Regent’s Park recorded so few house sales in the year that no house median can honestly be published for them.
Two wards are worth reading carefully rather than at face value:
- Highgate (£880,000) looks mid-table, but that single figure hides the widest gap in the borough. Its flats have a median of £630,136 and its houses £2,735,000, and the £25.9 million sale on Merton Lane sits in this ward too.
- Kilburn (£521,000) is the cheapest ward on the chart, and it is also the one that straddles the boundary with Brent. Only the Camden side is counted here, because the pull is filtered on the local authority district rather than the postcode.
The top and the bottom of the market
The highest recorded sale in the twelve months was £53,000,000 for 87 Avenue Road, NW8, a detached house in Primrose Hill ward, registered in September 2025. Behind it came £25.9 million on Merton Lane in Highgate and £16.5 million on Wadham Gardens.
The lowest standard sales in the borough were a pair of flats at £175,000, one on Tavistock Square in Bloomsbury and one on Camden Road. Both are real full-market transactions, not part-shares: this page excludes what the Land Registry calls “additional price paid” transactions, which cover repossessions, part-share transfers and portfolio deals and are explicitly not to be used for market analysis. Of the 1,616 records the Land Registry holds for Camden over this period, 312 were in that category and are left out here, along with the commercial “other” property type.
What it means for you
If you are buying, the borough average is not your number. Work out which of the two Camdens you are shopping in. A flat buyer should be looking at the £660,000 flat median and their target ward’s flat figure, and should treat the service charge and lease length as part of the price, because 82 per cent of this market is leasehold. A house buyer is in a thin market with very few comparable sales, so a single unusual transaction on a street can move an agent’s valuation a long way.
If you are selling, prices in Camden have fallen 6.2 per cent over the year on the official index while England has risen. Pricing against a 2022 or 2023 sale on your street will lose you months.
If you are weighing one part of the borough against another, two other pages here are part of the same decision: the travel times and fares from each Camden station, which is a real component of what a postcode costs, and what the council is planning to build and where.
Frequently asked questions
What is the average house price in Camden?
The average Camden home was worth £815,159 in July 2026 on the UK House Price Index, which is mix-adjusted. The median actual sale over the twelve months to June 2026 was £740,000 across 1,301 Land Registry transactions. The two figures differ because a small number of multi-million pound sales pull the average up.
Are Camden house prices going up or down?
Down, and falling again. Camden fell 10.1 per cent in the year to July 2026, against a 3.3 per cent fall across London and a 1.1 per cent rise in England. The borough has now dropped in two consecutive months, by £9,227 in June and £19,039 in July. That annual figure is measured from July 2025, at £907,073 the highest month the index has recorded for Camden since at least 2015.
What is the cheapest part of Camden to buy in?
Kilburn, with a median sold price of £521,000, followed by Bloomsbury (£524,000) and Regent’s Park (£541,000). All three are dominated by flats.
What is the most expensive part of Camden?
Hampstead Town, with a median of £1,600,000 across all sales and £3,597,500 for houses alone. Frognal and Primrose Hill follow.
How much is a flat in Camden?
The median flat or maisonette sold for £660,000 over the twelve months to June 2026, from 1,071 sales. Ward flat medians ranged from about £460,000 in Camden Town to £1,107,500 in Frognal.
Where can I check what a specific house sold for?
Every completed sale in England and Wales is public. Look up a street or a single address free on HM Land Registry Price Paid.
How this page counts
The sales figures come from one pull of HM Land Registry’s Price Paid linked
data API, filtered to propertyAddress.district=CAMDEN for transactions dated
1 July 2025 to 30 June 2026. From 1,616 raw records we keep only standard price
paid transactions and drop the commercial “other” property type, leaving 1,304.
Three more are dropped because postcodes.io places them outside the borough,
giving the 1,301 sales used throughout. Price Paid lags completion by roughly
six to eight weeks, so the most recent months are incomplete and will rise as
more sales register.
Sources
- HM Land Registry Price Paid data, Camden district for every sale, the medians and the ward breakdown.
- UK House Price Index, Camden (ONS and HM Land Registry) for the mix-adjusted average and annual change.
- UK House Price Index open data for the May 2026 Camden, London and England figures.
- postcodes.io for mapping each sale postcode to its Camden ward.
- HM Land Registry Price Paid search to check any individual address.
Figures are provisional and are revised as more sales complete. Always confirm the latest numbers against the linked HM Land Registry and ONS sources before making a decision.
Have your say