
The average Camden home is £833,067, down £63,506 in a year. But prices bottomed in April and have climbed 5% since. Hackney and Haringey rose instead.
The average Camden home was worth £833,067 in June, down £63,506 on the same month last year, according to the UK House Price Index published by HM Land Registry on 19 August.
That is a 7.1 per cent fall over twelve months, at a time when England as a whole rose 1.8 per cent to £293,262.
The headline is real. It is also, on its own, misleading about where the Camden market is now.
Prices bottomed in April and have gone back up
Camden’s average did not fall steadily through the year. The monthly series shows something more specific:
- July 2025: £907,557. The peak.
- April 2026: £793,161. The floor, £114,396 below it.
- June 2026: £833,067. Up £39,906, or 5.0 per cent, in the two months since.
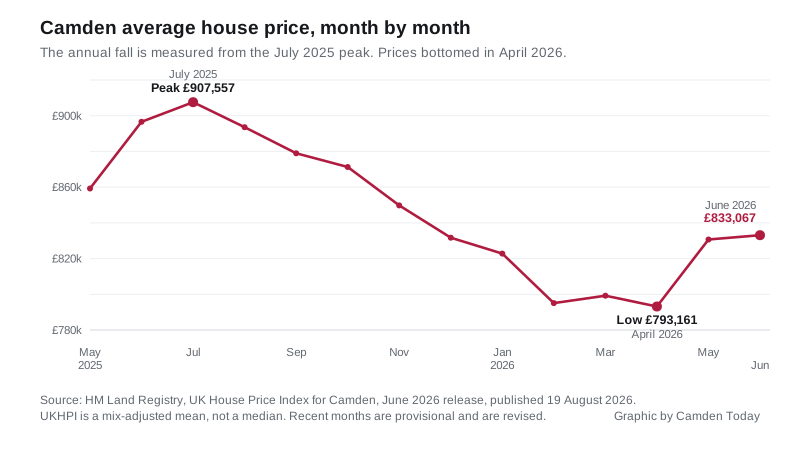
The annual comparison is measured against June 2025, and June 2025 was near the top of a sharp rise: the borough was up 6.6 per cent year on year that month, and 4.3 per cent on May alone. Comparing a recovering market against a peak produces a large negative number without anything having got worse recently. Camden rose 4.7 per cent in May and a further 0.3 per cent in June.
So both of these are true at once. Camden is £74,490 below its July 2025 high. It is also £39,906 above its April low.
Camden falls, Hackney and Haringey do not
The borough is not moving with London, and it is not moving with its neighbours either. Annual change in the year to June 2026:
| Area | Average price | Annual change |
|---|---|---|
| Westminster | £854,198 | -25.4% |
| Islington | £673,384 | -8.1% |
| Camden | £833,067 | -7.1% |
| Brent | £544,174 | -3.4% |
| Barnet | £603,753 | -2.9% |
| London | £553,870 | -2.5% |
| Hackney | £605,442 | +0.4% |
| Haringey | £634,444 | +2.5% |
| England | £293,262 | +1.8% |
The pattern is central versus outer. Westminster, Islington and Camden, the three most central boroughs in that list, all fell hard. Hackney and Haringey, a few miles further out, did not fall at all. Camden’s £833,067 is still the second highest average on the list, behind Westminster.
Flats are where Camden’s fall is
Camden’s average is a borough of flats, so the flat figure is the one most residents should read.
| Property type | Average price | Annual change |
|---|---|---|
| Flat or maisonette | £688,438 | -7.3% |
| Terraced | £1,569,143 | -5.7% |
| Semi-detached | £2,125,035 | -5.8% |
| Detached | £3,605,564 | -5.2% |
| First-time buyer | £728,951 | -7.1% |
Flats fell furthest over the year, and they dominate the borough: our analysis of Land Registry sales found 1,071 of 1,301 Camden sales in the twelve months to June 2026 were flats or maisonettes, 82 per cent of the market.
Flats also follow the same two-month turn as the borough overall. The Camden flat average bottomed at £655,364 in April and has risen to £688,438, a gain of £33,074 or 5.0 per cent. The detached and semi-detached averages above are built on a very small number of very expensive sales and should not be read as the price of a house on any particular street.
One caution that applies to every figure on this page. UKHPI is a mean average, not a median. It is mix-adjusted, so it is good at showing direction, but Camden’s mean is pulled upward by a handful of enormous sales. The median Camden sale over the same twelve months was £740,000, nearly £100,000 below the June mean.
The May figure has already changed
UKHPI revises earlier months as more completed sales are registered, and the revision this month was large.
Our own Camden house prices page, compiled on 14 August, recorded May 2026 at £805,837, down 6.2 per cent over the year. The Land Registry’s current figure for that same month is £830,654, down 3.3 per cent: nearly £25,000 higher, and less than half the annual fall. We have updated that page.
The practical lesson for anyone reading a house-price story: the most recent month in any release is provisional, and it usually moves. Sales volumes tell you why. Camden registered 170 sales in July 2025 and 81 in April 2026, the last month with a published count. Fewer sales means each late registration shifts the average more.
What it means for you
If you are selling, the number that matters is what comparable flats on your street have actually completed at, not the borough mean. Every completed sale is public in HM Land Registry’s Price Paid data, searchable by postcode, and it lags roughly seven weeks behind completion.
If you are buying, a 7.1 per cent annual fall does not mean you can offer 7.1 per cent under last year’s asking prices. Prices have risen for two consecutive months, and the fall is measured from a July 2025 peak rather than from where the market sits today.
If you are a first-time buyer, the Camden average for your group is £728,951, and a Lifetime ISA will not stretch to it. A LISA can only be used on a home costing £450,000 or less, and taking the money out for anything else carries a 25 per cent withdrawal charge. That cap sits well below even the borough’s average flat, at £688,438.
Update, 19 September 2026. The July index has landed and it reversed this story’s direction. Camden fell to £815,159, down 10.1 per cent on the year, and the borough has now dropped in two consecutive months. HM Land Registry has also revised the figures used in this piece: June now reads £834,198, May £843,425 and April £805,447, so April is no longer the floor of the cycle. February 2026 is, at £795,336. The full July figures are in our report on the July index.
Sources
- UK House Price Index, Camden, June 2026, HM Land Registry, published 19 August 2026, for every Camden figure and the monthly series.
- UK House Price Index for London and England, and for the boroughs of Westminster, Islington, Hackney, Haringey, Brent and Barnet, same release.
- HM Land Registry Price Paid data for the median and the flat share of sales.
Have your say